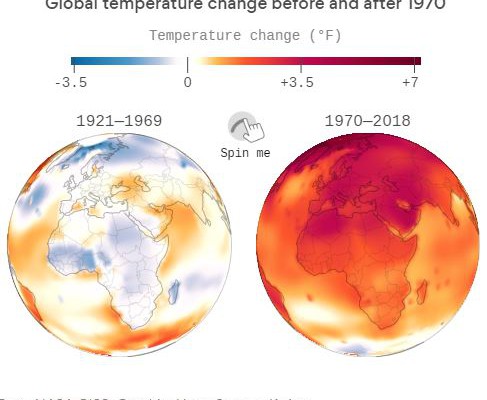
2018 was Earth’s 4th-warmest year on record, coming in behind 2016, the planet’s warmest recorded year, as well as 2015 and 2017, according to information released by NOAA, NASA and the U.K. Met Office.
Why it matters: The yearly rankings don’t tell the whole story of long-term climate change, since natural variability can still push or pull an individual year up or down the rankings. However, the overall picture is growing starker with each passing year. Nine of the 10 warmest years on record since reliable data began in 1880 have occurred since 2005. At the same time, greenhouse gases from the burning of fossil fuels — as well as deforestation and intensive agriculture — have skyrocketed to levels not seen in more than 800,000 years.
The latest: An unusually warm April followed a top 3 hottest March, and indicates that the Earth is headed for yet another top 3 warmest year on record. In addition, Arctic sea ice extent reached a record low for April, NOAA reports. This follows recent news that carbon dioxide levels in the atmosphere edged past 415 parts per million for the first time in human history, likely becoming the highest level on record in at least 3 million years.
By the numbers: For 2018, the average temperature across global land and ocean surfaces was 1.42°F (0.79°C) above the 20th century average, according to NOAA.
- According to NASA’s Goddard Institute for Space Studies (GISS), global temperatures in 2018 were 1.5°F (0.83°C) warmer than the 1951–1980 mean.
- Analyses from the U.K. Met Office and the World Meteorological Organization also ranked 2018 among the top 4 warmest years on record.
- Each group relies on similar surface temperature data but uses different methods and baselines to fill in gaps between observing stations.
- According to NOAA, the annual global land and ocean temperature has increased at an average rate of 0.13°F (0.07°C) per decade since 1880. However, this rate has more than doubled, to 0.31°F (0.17°C) per decade, since 1981.
The big picture: “The impacts of long-term global warming are already being felt — in coastal flooding, heat waves, intense precipitation and ecosystem change,” Gavin Schmidt, director of NASA GISS, said in a press release.
- Since the 1880s, the average global surface temperature has risen about 2°F (1°C), which Schmidt — along with the vast majority of climate scientists — attributes largely to increased emissions of greenhouse gases due to human activities.
- Increasing average temperatures are most pronounced in the Arctic, where temperatures have jumped at more than twice the rate of the rest of the globe, triggering sea ice and land-based glaciers to melt.
- Record high annual temperatures over land surfaces were measured across much of Europe, New Zealand, and parts of the Middle East and Russia. No land areas were record cold for the year, NOAA found.
Between the lines: Global average surface temperatures are edging closer to the 1.5°C aspirational warming target contained in the Paris climate agreement, which many low-lying island nations see as key to their survival, but the world’s energy system is marching in the wrong direction for limiting global warming’s severity.
- Global carbon dioxide emissions from the burning of fossil fuels such as coal, oil and natural gas ticked up in 2018, to the highest levels in recorded history, according to the Global Carbon Project and the International Energy Agency.
- A separate report showed that U.S. carbon emissions from energy — which is the overwhelming cause of planet-warming emissions — jumped by 3.4% last year, ending years of declines.
- In order to meet the Paris agreement’s 1.5°C goal, global emissions of greenhouse gases would have to fall by 45% by 2030 and reach “net zero” by mid-century.
https://www.axios.com/climate-change-earth-temperature-change-902e2958-451b-4044-a6a3-8dab46902da6.html

 TheAltWorld
0 thoughts on “Climate change visualized: How Earth’s temperature has changed since 1970”